Node-RED MQTT Monitoring: Cover Connection Loss Beyond the Catch Node
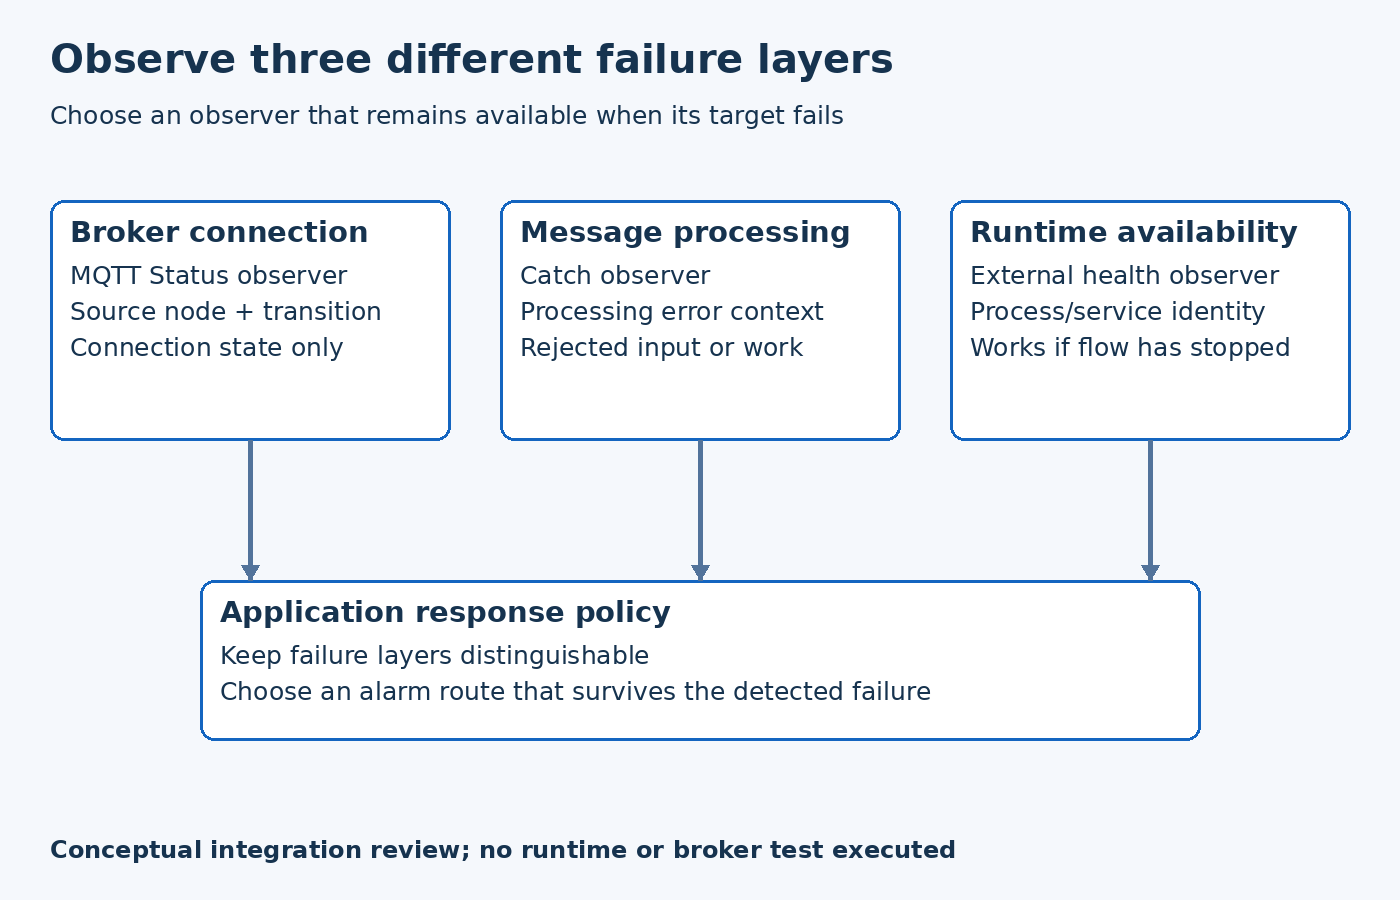
A Catch node beside an MQTT flow does not establish that broker outages will produce an alarm. Build the monitoring design around three separate observations: connection status, message-processing errors and the continued operation of the Node-RED runtime. Then decide which observation is sufficient to stop, hold or flag each application action.
Consider a hypothetical machine-monitoring gateway that transforms incoming MQTT measurements and sends a derived result to another system. Its normal path works, and an invalid transformation produces a visible error. Disconnecting the broker, however, may leave the error-handling branch quiet. The missing alarm is a coverage gap in the flow, rather than proof that the connection remains healthy.
Give each failure a reporting path
The official Node-RED error-handling guide explicitly distinguishes MQTT connection-status changes from errors caught by a Catch node. It also distinguishes log-only errors, runtime-notified errors and exceptions that can terminate the runtime. These categories require different observation paths.
Use a Status node for the relevant MQTT nodes, a Catch node for failures reported by the processing nodes, and an external runtime-health observation for a stopped process. Keep these inputs distinguishable. A red connection indicator, a rejected payload and a missing process are different findings, even if the operator dashboard eventually groups them under one equipment alarm.
For the hypothetical gateway, define three output records: broker connection unavailable, measurement rejected, and gateway runtime unavailable. Attach the source node or process identity and the observation time. Do not manufacture a broker error code from a generic status change; connection-level protocol diagnostics belong in a separate investigation.
Scope monitoring to the deployed flow
A large workspace can contain several MQTT connections and several processing branches. Document which source nodes each observer covers. A monitor that worked on a development tab may not cover a newly separated production flow. Test the actual deployed layout, including subflows, rather than relying on the placement of a nearby error node.
The Node-RED 5.0.8 MQTT implementation updates user-node status when its broker connection closes or disconnects. That is useful evidence for selecting a status-based observer. It does not make a green status an acknowledgement from the destination application.
Treat connection recovery as permission to reassess the application path. For example, an upstream sensor can remain silent after the connection returns. A downstream service can also reject a valid publication. Neither condition should be hidden by replacing every equipment alarm with the latest broker status.
Prevent the alarm from depending on its failed route
If the only alarm output uses the same unavailable broker connection, the flow may detect an outage without delivering the notification. Decide whether the system needs a local operator indication, an independently available management route or a recorded incident that can be retrieved later. Choose the route according to the actual deployment; adding another cloud dependency is not automatically an improvement.
Also define how repeated status changes are presented. A flapping connection should not create an unbounded stream of indistinguishable notifications. Preserve the first observation, current state and relevant transitions while applying the agreed notification policy. Keep that presentation policy separate from machine safety or control decisions.
Verify coverage with distinct disturbances
In an isolated integration environment, propose separate exercises: interrupt the broker connection, submit a deliberately invalid measurement to the transformation path, and stop the runtime through its approved service-management procedure. For each exercise, name the expected observer before conducting it.
Compare the resulting records with those expectations. A connection interruption should reach the connection observer; a processing error should retain its source context; a stopped runtime must be visible outside the stopped flow. Restore normal operation and check that the recovery indication corresponds to the intended layer.
These exercises have not been executed for this article. They form an acceptance plan for the actual versions, nodes and monitoring services selected by the project. The deliverable is a coverage map showing how each important failure becomes observable, with any unsupported case stated explicitly. That is stronger evidence than a working Catch branch alone.