Firmware Rollout Experiments: Separate Software Regressions from Changed Fleet Conditions
Compare releases within a planned, comparable population before interpreting an aggregate canary percentage. Hardware mix, region, workload, backend changes and telemetry availability can change at the same time as firmware. A lower pooled failure rate can coexist with a worse rate in every observed hardware class.
This article provides a comparison-design worksheet and a synthetic arithmetic example. It does not report fleet results, prove a regression, or prescribe a significance threshold. The example’s ten fraction-arithmetic assertions were run with Python 3.12.14; no device experiment or statistical inference was performed.
1. Write the decision and comparison before exposure
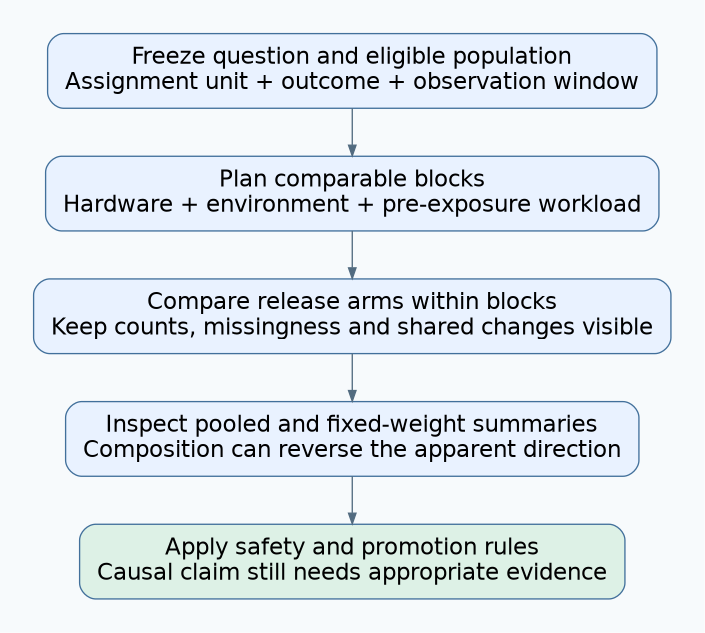
Specify the primary question: for example, whether the new release increases a defined device-level failure outcome during a fixed operating interval among currently eligible controllers. Freeze the outcome definition, exposure window and eligibility rules before inspecting results.
Separate that question from operational safety limits. A serious malfunction may justify stopping new exposure immediately even when causal attribution is uncertain. Conversely, no observed malfunction in a small selected group does not establish safety throughout the fleet.
Record changes that would make the comparison uninterpretable: a different backend version applied only to one arm, a changed telemetry endpoint, or a workload shift that removes comparable controls. Define whether each event pauses exposure, pauses promotion, or requires a redesigned comparison.
2. Choose the experimental unit and the shared environment
NIST’s randomized-design guidance describes assigning factor levels to experimental units. For firmware, identify what actually receives the assignment: a device, site, gateway cluster or other operational unit.
Do not treat thousands of messages from one device as thousands of independently assigned devices. If devices share a gateway, power supply or backend shard, record that shared environment. Where firmware on one device changes conditions for another, a device-level split may contaminate the comparison; a site-level design may be needed.
A deterministic canary bucket can preserve membership. It does not by itself prove random assignment, balanced environments or independence. Document how eligibility, manual exceptions and assignment interact, then audit the resulting population before interpreting outcomes.
3. Block the important known differences
NIST’s blocking guidance groups experimental units with similar nuisance-factor conditions so the primary factor can vary within a block. Apply that idea prospectively to a small number of technically important fleet dimensions, rather than dividing the data into hundreds of empty categories afterward.
| Design field | Example question | Required record |
|---|---|---|
| Hardware | Do memory or radio revisions change failure risk? | Approved hardware strata and both release arms within each |
| Operating environment | Are region, carrier or temperature conditions comparable? | Chosen blocks and unexplained differences |
| Workload | Are transaction rates and feature use comparable before assignment? | Pre-exposure workload classification |
| Calendar period | Did network or backend conditions change during rollout? | Concurrent control window and shared changes |
| Assignment | Can both approved releases be assigned within each block? | Assignment unit, method and exceptions |
Only compare approved, eligible releases. Do not withhold a required security update merely to preserve a convenient experiment. If a controlled comparison is inappropriate, use an explicitly observational design and state the remaining confounding limits.
4. Inspect composition before pooling
The following invented counts use the same device-level outcome and observation rule. They demonstrate arithmetic, not a meaningful sample-size recommendation.
| Hardware stratum | Old release failures/devices | New release failures/devices |
|---|---|---|
| A | 1/100 = 1% | 4/200 = 2% |
| B | 18/100 = 18% | 2/10 = 20% |
| Pooled | 19/200 = 9.5% | 6/210, approximately 2.86% |
The new release has a higher observed failure proportion in both strata, yet a lower pooled proportion because its population contains far more class A devices. The aggregate alone would support the wrong descriptive story.
For an explicitly hypothetical target mix of equal A and B weights, the weighted rates are 9.5% for old and 11% for new. This standardization holds composition fixed; it does not remove unmeasured confounding, estimate uncertainty, or prove that firmware caused the difference. Choose target-population weights before selecting a favorable result, and retain the raw stratum counts beside the summary.
5. Do not adjust away consequences of the update
Use pre-exposure characteristics for the planned comparison. Suppose the new firmware increases resets, which reduce reported workload. Matching only devices with the same post-update workload can select a distorted subset and hide part of the problem.
Similarly, excluding devices because they stopped uploading after installation may remove the most important failures. Keep loss of observation visible and investigate whether the release affected the observer. Comparable denominators are a prerequisite, but this decision concerns how population selection changes the release contrast.
Maintain assignment records alongside actual exposure. A device assigned new firmware but never installed it is operationally different from one that installed and failed. Predefine how each analysis handles that distinction; avoid quietly moving difficult cases into the control group after seeing their outcomes.
6. Tie observations to bounded decisions
- Both arms worsen together: investigate shared conditions; do not exonerate the release automatically.
- One hardware stratum diverges: hold promotion for that class and reproduce its conditions.
- Only the pooled result improves: inspect changed composition and fixed-weight summaries.
- Controls are missing in an important block: report that comparison as unsupported.
- Telemetry disappears selectively: treat the observation process as a possible failure mechanism.
- A severe incident occurs: apply the safety stop rule while attribution remains open.
Before making a statistical claim, use an analysis appropriate to the assignment unit, repeated observations, sparse strata and repeated interim checks. A dashboard refreshed every minute does not justify repeatedly testing until a convenient threshold appears.
7. Close with a comparison evidence package
Deliver the frozen question, eligibility snapshot, assignment method, blocking worksheet, exceptions, observation windows, stratum counts and known shared changes. Include the reason for each promotion or hold and the reproducible engineering tests that follow suspicious patterns.
The useful outcome is an honest distinction between a changed population, a release-associated signal and a reproduced mechanism. Keep those claims separate even when operational caution requires action before the causal question is settled.