Selective SLUB Debugging: Locate a Corrupted Object Without Instrumenting Every Cache
Enable only the SLUB checks needed for a verified suspect cache, then interpret the corruption marker together with allocation and free history. A stack printed when an object is checked usually identifies where corruption was discovered. It may be far from the instruction that originally wrote the bad byte.
The baseline is upstream Linux v6.12 with SLUB debugging support available. Configuration, cache layout and report details can differ in vendor kernels. This guide does not substitute SLUB checks for a complete memory-safety campaign, and it contains no executed boot change or corruption test. All names in the worked example are fictional.
Confirm that the target object belongs to the selected cache
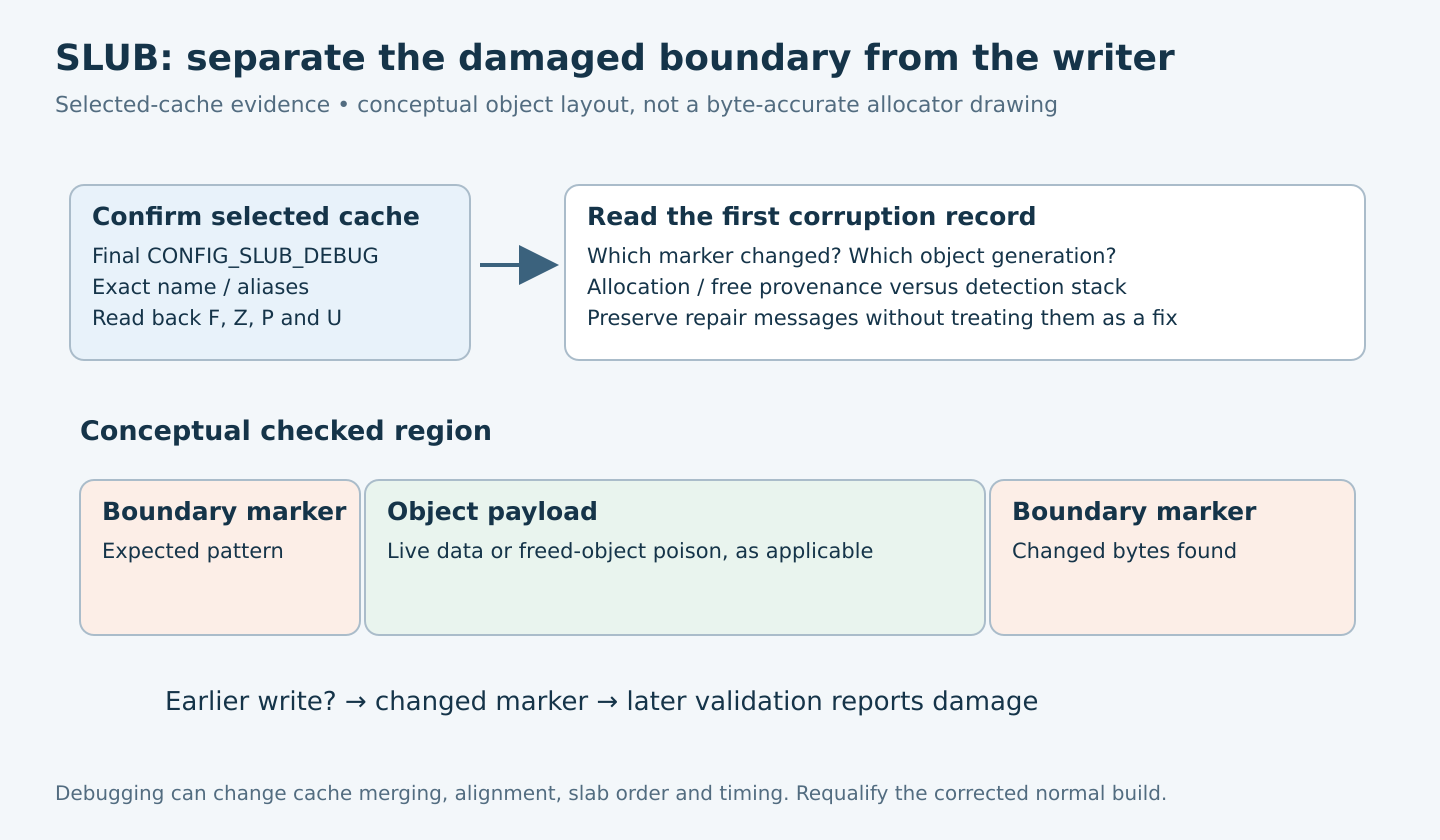
Start with allocation provenance: a dedicated kmem_cache, an ordinary size-class allocation, or a different allocator. Identify the cache name on the running diagnostic image and the call path creating the object. A guessed name in a boot argument can leave the actual allocation uninstrumented.
The v6.12 configuration makes CONFIG_SLUB_DEBUG depend on sysfs and excludes SLUB_TINY. CONFIG_SLUB_DEBUG_ON changes the default activation policy. Verify the final configuration before assuming debugging can be enabled later.
Check cache aliases and merging. The tagged SLUB guide describes slabinfo -a for merged caches. Selecting a shared size class can affect more callers than the suspect driver. Conversely, debug settings can prevent merging and change layout. Record that difference as part of the experiment.
Select a small set of checks
For a dedicated fictional cache named example_req, the v6.12 boot-parameter form slab_debug=FZPU,example_req requests consistency checks, redzones, poisoning and allocation/free tracking for that named cache. This is an illustrative configuration string, not a command to apply blindly; it is meaningful only if that exact cache exists and the kernel supports the options.
Fenables consistency checking.Zadds redzone checks around object boundaries.Pchecks poisoning of objects or padding as applicable.Urecords allocation/free tracking information.
Use the smallest useful combination first. Global tracing can flood the log and perturb the workload; the documentation specifically cautions about the trace option. Redzones and tracking may realign objects or increase minimum slab order, which can introduce allocation failures under pressure. The separate O policy can disable debugging on caches that would require higher minimum orders, so verify actual activation rather than assuming requested coverage survived.
Read back effective cache state
After booting the recoverable diagnostic image, inspect the selected cache’s sysfs entries. The documented mappings include sanity_checks, red_zone, poison and store_user. Their values establish whether the intended options are active for that cache. Save the final boot command line and cache identity with the readback.
Do not infer allocation history from a report generated before tracking was active. Keep startup allocations in scope when the object is long-lived. If the test requires a newly created object, use an approved driver lifecycle operation and confirm its generation rather than repeatedly reloading unrelated modules.
Interpret a synthetic report without inventing a writer
| Synthetic observation | What it supports | What it does not establish |
|---|---|---|
| Cache example_req reports changed right-redzone bytes | A checked boundary marker differs from its expected pattern | The identity of the original writer |
| Allocation history points to create_request() | Provenance of the affected object | That allocation itself wrote out of bounds |
| Current stack reaches release_request() | Corruption was discovered during this validation/free path | That release_request() caused the overwrite |
| Poison bytes changed after a recorded free | A post-free modification hypothesis worth tracing | Which stale owner or external writer performed it |
The v6.12 implementation checks expected bytes and emits region-specific reports. Inspect the full object, marker and padding information before reducing the finding to “heap corruption.” A modified terminator near an object boundary suggests a different source review from a broad overwrite spanning several objects, but both remain hypotheses until a write path is identified.
Keep the original log before any diagnostic repair message. Restoring a marker can let analysis continue; it does not repair the driver that damaged it. A later normal operation is therefore not evidence that the corruption was harmless.
Design a cache-focused reproduction
- Choose the operation that allocates and releases the affected object, and establish its normal success behavior.
- Repeat that lifecycle with the confirmed cache settings, recording object generations and bounded application checkpoints.
- Vary the input dimension tied to the suspected write: payload length, terminator handling, descriptor count or cancellation timing.
- Preserve the first report and stop the case when subsequent behavior can no longer be trusted.
- After the source change, repeat the original trigger, neighboring valid inputs and all affected cleanup branches.
For a hypothetical request builder, suppose the corruption occurs only when a variable-length name exactly fills the payload area. Review both the encoded length and any terminator before concluding that the allocation is one byte too small. An external format may not require a terminator at all; the correct repair depends on the interface contract.
A deliberate overrun is not necessary to diagnose a naturally reproduced defect. If the team uses a synthetic negative fixture to validate the report channel, confine it to an isolated, recoverable test kernel with no valuable workloads. This article does not provide or execute a fault-generating module.
Account for what instrumentation changed
Compare operation completion, memory headroom and allocation failures with the baseline image. A debug image that fails earlier because slab orders grew may never reach the original writer. Keep that as a different failure category rather than merging it into the corruption count.
Likewise, a disappearing failure can result from new spacing between objects or altered timing. Use the changed layout to test a hypothesis, then repeat on a production-like build after correcting the source. An absence of marker damage does not prove that every write stayed within its intended object, especially when damage remains in an unchecked region or no later validation examines the affected marker. SLUB checks selected state at validation checkpoints rather than instrumenting every write; a device-originated write can still be detected later if it damages a checked marker.
Define a useful exit criterion
Deliver the cache-selection evidence, effective flags, first report, allocation/free provenance, candidate writer and regression inputs. Accept the correction when the boundary or lifetime rule is explicit and the workload still exercises the previously failing operation without unexplained corruption.
Retain a separate status for incomplete provenance, aliases that broaden coverage, and paths that only run without instrumentation. Selected-cache debugging is valuable because its evidence is specific; it loses that value when a clean log is presented as universal memory-safety proof.