Corrected NAND Bit Errors: Decide When to Observe, Refresh or Retire a Device
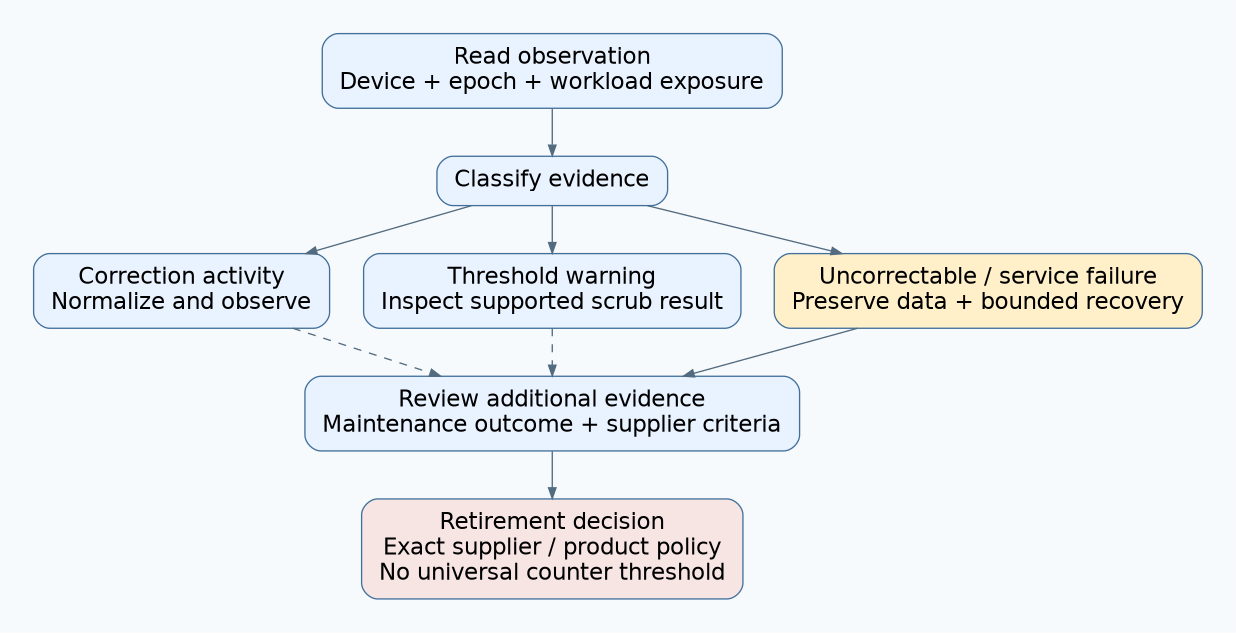
An increasing corrected-bit counter is a reason to inspect the read workload and correction margin, not a direct estimate of remaining NAND life. Separate successful correction, a threshold-triggered warning, uncorrectable reads, and block retirement. Those observations lead to different actions.
This guide is pinned to Linux v6.12 MTD and UBI. It concerns host-visible NAND correction evidence, not managed eMMC lifetime fields. Exact NAND, controller, ECC mode, driver, and storage-stack behavior govern interpretation. The proposed decision table has no universal retirement threshold and reports no measured device endurance.
1. Name the quantity before plotting it
The v6.12 MTD sysfs ABI distinguishes corrected_bits, ecc_failures, ecc_strength, ecc_step_size, and bitflip_threshold. Correction strength applies within an ECC step. The threshold governs when a read reports -EUCLEAN, based on the maximum corrected errors in an individual step, rather than the lifetime sum of corrected bits.
The MTD core implementation exposes correction and failure statistics through separate counters. Capture their identity and collection epoch with every sample. A reboot, driver reload, device replacement, or counter wrap can invalidate a simple subtraction. Do not turn a counter decrease into a negative error rate.
| Quantity | Useful interpretation | Invalid shortcut |
|---|---|---|
| Correction-counter delta. | Reported correction activity during a defined observation window. | Number of newly damaged physical cells. |
| Per-read maximum corrected errors. | Correction demand within the reported step scope. | A device-wide percentage of remaining life. |
| Threshold warning. | The configured warning criterion was met. | The block must immediately be permanently retired. |
| ECC failure report. | The correction path reported an inability to correct the relevant data. | The application received a valid payload anyway. |
| Bad-block count. | The selected device or partition reports blocks classified as bad. | The same quantity as corrected bits. |
Inspect the driver mapping behind the counters. Some device status interfaces provide categories rather than an exact corrected-bit count. If the driver reports a conservative estimate or a category boundary, preserve that limitation in the metric name and trend interpretation.
2. Normalize the observation window
Record bytes read, read operations, address coverage where available, elapsed time, temperature conditions, firmware revision, and whether a maintenance scan ran. Keep the raw counters as well as any normalized view. Comparing correction counts from different read workloads can create a false deterioration story.
A repeatedly read weak page can contribute correction activity repeatedly. Conversely, a quiet device can show a flat counter because the relevant data was never read. A zero delta therefore does not prove that all stored data is healthy. Do not launch an aggressive full-device read loop merely to improve the graph; qualify its load and media implications first.
A useful observation record identifies one MTD device or partition consistently. Avoid adding parent-device and partition statistics without understanding whether their scopes overlap. Correlate a logical-volume symptom with the underlying device identity, while recognizing that UBI can relocate data between physical eraseblocks.
3. Understand the storage stack’s existing refresh behavior
In v6.12, UBI translates MTD’s corrected-bit warning into UBI_IO_BITFLIPS. The eraseblock-association read path can schedule scrubbing through ubi_wl_scrub_peb. See the pinned UBI I/O implementation and UBI read path.
This is a reason to inspect existing behavior before adding an application rewrite loop. A request to scrub is not evidence that relocation completed successfully. Collect the subsequent result, available capacity, any read-only transition, and application-visible errors.
Refreshing data is also different from declaring a physical block bad. The product should use the supported UBI and media policy rather than bypassing it with direct raw writes beneath an attached volume. Never erase a suspect block containing the only copy of data to see whether its warning disappears.
4. Choose an escalation from the evidence
| Observation | Proposed action | Evidence needed before escalation |
|---|---|---|
| Corrections rise with a newly added read scan; payloads remain verified. | Observe under comparable workloads and review scan cost. | Read volume, coverage, driver counter meaning, and prior baseline. |
| Threshold warnings recur at a known location or logical workload. | Inspect supported scrub/refresh behavior and protect important data. | Threshold, ECC mode, relocation result, and recurrence after maintenance. |
| Scrub cannot complete or repeated storage errors affect service. | Enter the product’s bounded degraded/recovery path. | Specific error, remaining storage resources, and validated recovery options. |
| Uncorrectable data is reported. | Preserve evidence and stop treating the affected content as trustworthy. | Application integrity checks, independent copies, and supplier-supported disposition. |
| Supplier-defined retirement conditions are met. | Retire the affected resource or unit through the approved service process. | Exact component policy and a safe data-preservation plan. |
The last row deliberately contains no generic count. A supplier may specify a policy based on conditions unavailable to ordinary application telemetry. If those conditions cannot be established, label the decision as uncertain and escalate rather than inventing a remaining-hours estimate.
5. Validate the policy without damaging production media
- Use a synthetic driver or approved fault-injection fixture to generate clean, corrected-warning, uncorrectable, and ordinary I/O-error outcomes separately.
- Verify that monitoring preserves those categories and does not convert every nonzero return into the same alarm.
- Inject a counter reset and wrap boundary into the telemetry model; require a new observation epoch or explicit discontinuity.
- Change the fixture’s read rate while keeping its per-read correction behavior fixed. Confirm that the dashboard does not interpret increased activity as new physical defects.
- Exercise the supported maintenance path on disposable test data and observe completion, failure, and resource exhaustion.
- Verify that a failed read cannot publish stale buffer contents as a newly validated sample.
No such target tests were run here. Software injection checks classification and control flow. Real media qualification additionally requires the documented device, environmental conditions, driver behavior, and an independent payload oracle.
Hypothetical fleet observation
A release adds a daily diagnostic scan, and correction counters rise faster afterward. The maintenance dashboard predicts imminent failure from the larger daily delta. Comparing the new scan volume with the old workload reveals that the metric changed its exposure, not necessarily the underlying media condition.
The corrected report shows read-normalized activity, warning categories, and maintenance outcomes, with uncertainty attached to driver estimates. Engineers still investigate repeated near-limit corrections, but they no longer present a lifetime countdown unsupported by the interface. That is the appropriate boundary between observing, refreshing, and retiring NAND.