Gateway Condensation: Compare Dew Point with the Coldest Surface
A gateway can report moderate relative humidity while a cold part of its enclosure approaches condensation. The humidity reading describes air at the sensor’s temperature; it does not establish the temperature of every nearby surface. A useful environmental review therefore compares the air’s dew point with the coldest relevant surface, especially while the gateway is cooling down or being moved between environments.
The preserved Google Trends export for July 19–October 19, 2026 lists “industrial iot solutions” as RISING at +110%, worldwide, all categories, web search. It supports the broader integration topic, not title-specific search growth or evidence that any particular gateway has a moisture problem.
Start with the physical boundary
Sensirion’s Introduction to Humidity, version 2.0, defines dew point as the temperature at which cooling a quantity of air at constant pressure leads to saturation. Its equation 12 calculates dew point from relative humidity and temperature. Table 1 supplies the above-water Magnus parameters beta = 17.62 and lambda = 243.12°C. The following worked example uses that approximation near ordinary ambient conditions, not a model for ice or an extreme-pressure installation.
For the gateway, define three separate observations: air temperature, air relative humidity and surface temperature. The first two should describe the same local air condition. The third belongs to a named physical location, such as an enclosure wall near an external cold mounting plate. A processor’s internal temperature sensor is not a substitute for that surface measurement.
Draw these locations on the enclosure section before selecting an alarm. If the only sensor is beside a warm processor, call its reading what it is. It may remain useful, but its relationship to the potentially cold region must be established rather than assumed.
Work through one reproducible calculation
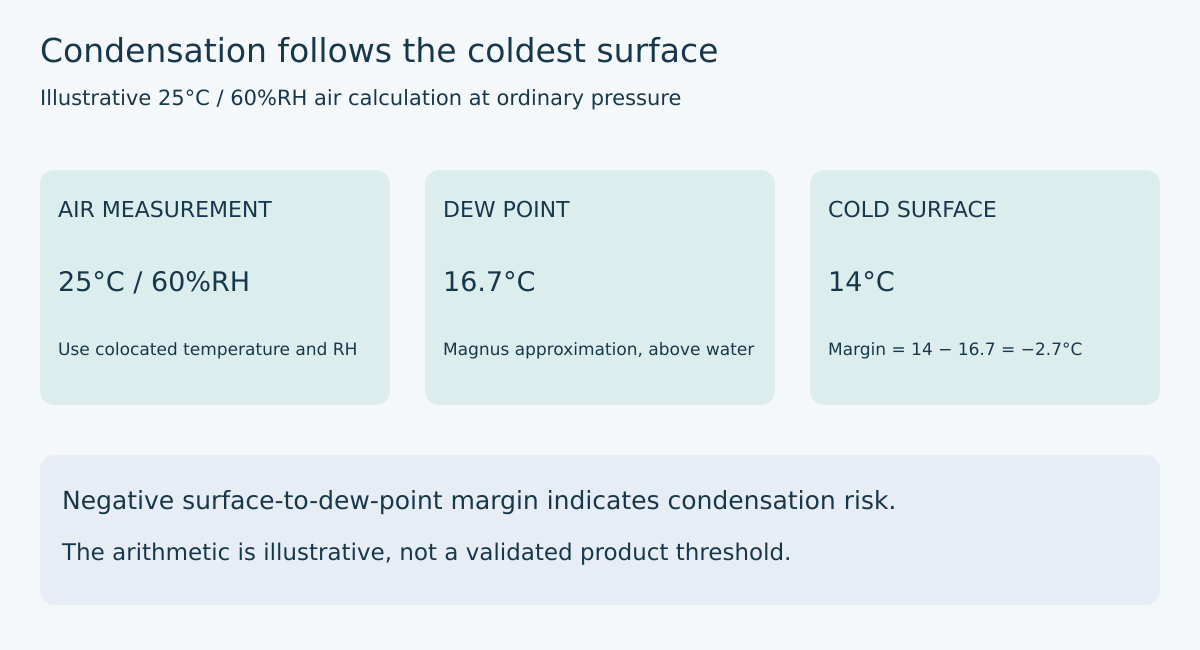
For an illustrative air condition of 25°C and 60%RH, first express relative humidity as a fraction, 0.60. Define gamma = ln(0.60) + 17.62 × 25 / (243.12 + 25). Then the approximate dew point is 243.12 × gamma / (17.62 − gamma), or about 16.7°C.
If a monitored surface is at 14°C, its surface-to-dew-point margin is 14 − 16.7 = −2.7°C. That negative margin indicates a condensation risk for air reaching that surface under the assumed conditions. It does not predict droplet size, the amount of deposited water or the time until a circuit malfunctions.
If the surface instead reaches 20°C, the same arithmetic gives a positive margin of about 3.3°C. Do not turn that single example into a product acceptance threshold. Sensor uncertainty, spatial variation and transient response still need an allowance chosen for the actual design. These values are calculated examples, not measurements from an Obeita product.
A software unit test can preserve the example as a reproducible check. It should also reject an invalid humidity input rather than taking the logarithm of zero or silently interpreting 60 as a fraction. Store the input units and equation version with the implementation. A tidy dashboard cannot repair a percent-versus-fraction error.
Follow shutdown as carefully as startup
A qualification plan that observes only a powered, thermally stabilized gateway may miss the state of interest. Propose a time-aligned record covering the transition from operating to unpowered and the next startup, within the product’s authorized environmental limits. Keep the air and surface channels synchronized with the power-state log.
This is not a request to spray water into equipment or power a visibly wet board. Use an appropriately controlled low-voltage test setup and a reviewed environmental procedure. If moisture is observed, stop and follow the product’s safe recovery procedure; a positive computed margin later does not prove the assembly is dry.
Plot the calculated margin over time, not only the humidity trace. Mark which surface generated each trace. If a single minimum-margin value is reported, retain the underlying timestamp and sensor identity. Otherwise, a later reviewer cannot tell whether the apparent minimum came from a real cold surface, a stale humidity reading or a disconnected sensor.
Keep uncertainty in the same units as the decision
Suppose the measured surface temperature has an uncertainty interval and the dew-point estimate has another. A simple conservative screening calculation uses the lower plausible surface temperature and the higher plausible dew point. This is an engineering screening approach, not a formal statistical confidence calculation.
For the hypothetical positive-margin case, a 20°C surface with a ±1°C measurement allowance and a dew-point estimate of 16.7°C with a ±1°C allowance leaves only 1.3°C in that conservative comparison. The example shows why reporting a nominal 3.3°C margin without its assumptions can exaggerate confidence. It does not prescribe one-degree uncertainty for real sensors.
Time response matters as well. A humidity sensor and a surface probe may respond at different rates. Evaluate the effect of those delays under the transition being studied. Increasing the logging frequency does not make a slow sensor respond faster, and interpolation cannot recover a physical transient that was never observed.
Choose a mitigation that addresses the measured mechanism
The investigation may motivate changing sensor placement, reducing a cold thermal bridge, controlling the permitted startup conditions or revisiting moisture-management features with the enclosure designer. Each is a different intervention with different verification needs. Do not assume that increasing processor workload is an acceptable heater or that an ingress-protection label establishes the internal dew-point margin.
If a heater or ventilation change is proposed, review its power, temperature, reliability and enclosure implications separately. Compare the revised design against the original time-aligned surface-margin record under equivalent conditions. A mitigation that improves the warm steady state but not the vulnerable transition has not answered the original question.
The useful deliverable is a surface map, a documented dew-point calculation and a power-state-aligned margin trace with uncertainty. It connects an environmental observation to the location where condensation can occur. A standalone relative-humidity percentage cannot make that connection on its own.
Primary reference
- Sensirion, Introduction to Humidity: Basic Principles on Physics of Water Vapor, version 2.0, August 2009: Table 1 on page 1 and section 2.2, equation 12, on page 2. Numerical examples, the margin worksheet and proposed test sequence are original analysis, not a certified environmental qualification.