cgroup v2 Memory Limits on Embedded Linux: Separate Throttling, OOM Events and Service Recovery
A cgroup memory event identifies an enforcement event, not an application defect. Diagnose a slow or restarted embedded service by aligning its cgroup counter changes, memory composition, pressure measurements, and supervisor decisions on one timeline. Then test whether the workload exceeds an intentional budget, grows without bound, or suffers pressure imposed elsewhere. Those explanations can coexist, so a successful restart is not a root-cause finding.
This procedure uses the Linux 6.12 cgroup v2 interfaces. Confirm the deployed kernel configuration, vendor patches, hierarchy, and available files before applying it. It does not cover cgroup v1, prescribe universal memory budgets, or assume that every product uses systemd. Limit changes and deliberate exhaustion belong on a recoverable qualification device, with actuators isolated and a known recovery image.
1. Identify the actual enforcement boundary
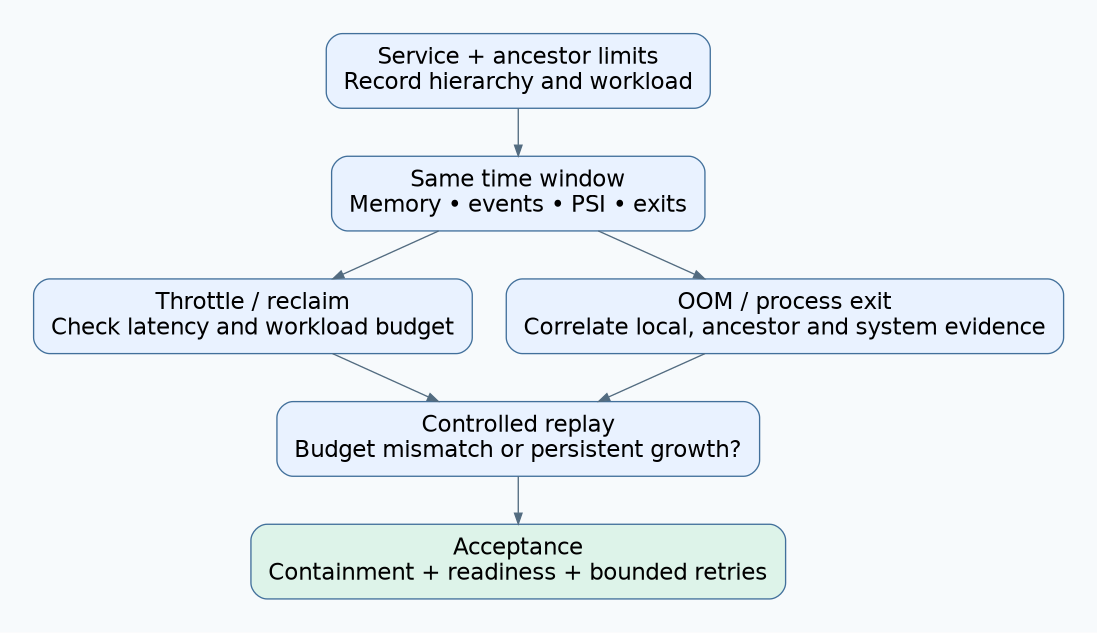
Begin with the affected service’s process identity and membership, then record its parent groups. Inspect the configured limits at each level rather than assuming the service’s own settings are decisive. Save the hierarchy identity alongside each sample; otherwise, a service restart that recreates its group can make a new set of counters look like pressure disappeared.
The Linux 6.12 cgroup v2 reference distinguishes memory.high, which applies reclaim pressure and throttling without itself invoking the OOM killer, from memory.max, where unsuccessful reclaim can trigger a cgroup OOM. Limits are hierarchical. memory.events normally includes descendants; memory.events.local isolates local events. Check the memory_localevents mount option before interpreting aggregation.
Create a small investigation record: service build, process IDs, cgroup path, ancestor limits, swap policy, workload phase, and collection timestamps. Keep the collector outside the deliberately stressed service group. Confirm that it can still report while the service stops responding. This is a test-design recommendation, not a guarantee of isolation from system-wide exhaustion.
2. Measure impact as well as occupancy
Take before-and-after snapshots of memory.current, memory.stat, the two event files, and available memory.pressure data. Collect application completion counts and response latency in the same interval. Record supervisor exits, restarts, and kernel OOM messages separately. A dashboard showing only occupied bytes cannot explain which work was delayed or who terminated a process.
Pressure Stall Information measures time lost waiting on resources. Its memory some metric covers intervals with at least some stalled tasks; full covers simultaneous stalls of all non-idle tasks in the relevant scope. Cumulative totals support interval comparisons, while averages smooth recent activity. These are stall-time indicators, not byte counters or direct measurements of a particular function’s latency.
For qualification, associate each sampling window with an input sequence number. Compare an idle period, steady traffic, the largest approved burst, and recovery after the burst. Use the same workloads when changing a limit. If input volume changes at the same time, the experiment no longer isolates the policy.
3. Interpret events without collapsing them into one alarm
The kernel reference defines high as throttle/reclaim events, max as attempts to exceed the maximum, and oom as limit-related allocation failure conditions. oom_kill counts member processes killed by any OOM killer. Therefore, it cannot alone prove that the service’s local limit caused the kill. Compare event deltas with kernel and supervisor records.
- High-event growth with slower responses: investigate whether the enforced working-set budget meets the product’s latency requirement. Record a pressure association; do not label it a leak.
- Maximum events without a kill: inspect whether useful work continued. Escalate missed deadlines even when the process survives.
- A kill with matching local OOM evidence: investigate containment and recovery as well as memory demand. Preserve the pre-failure workload window.
- A kill without that local evidence: check ancestors, system-wide OOM records, and userspace termination decisions before attributing it to the leaf limit.
- A restart without any corroborating memory event: follow the recorded exit reason. A restart counter is not a memory diagnostic.
4. Separate a budget problem from persistent growth
Run repeatable work cycles with a defined quiet period between them. Record the post-cycle memory floor, completed units of work, queue depth, and major categories from memory.stat. A rising floor is a useful lead, but still needs ownership evidence. Changes in caches, retained queues, and allocator behavior can resemble a leak in a coarse graph.
The kernel’s memory-management concepts overview explains that file data may remain in page cache and that reclaim handles different memory types differently. Consequently, treating all occupied memory as lost heap space is an invalid shortcut. Use application allocation or lifetime diagnostics only after identifying which category merits investigation.
Perform two bounded comparisons. First, reduce admitted concurrency without changing the software. Second, on an adequately provisioned test board, grant a larger service budget while preserving the input sequence. If delay disappears and the post-cycle floor stabilizes, the evidence supports a budget or concurrency mismatch. If growth persists across equivalent completed cycles, investigate retention. Neither result licenses unlimited production memory allocation.
5. Qualify recovery as an explicit product behavior
Write down what the supervisor is expected to do after one worker dies, after the whole service fails, and after repeated failures. Include restart backoff, request rejection during recovery, retained transaction state, and the condition that stops automatic retries. Do not assume that killing one process leaves its peers in a valid application state.
Exercise recovery with a controlled test workload and preserve a separate event record for each attempt. Verify that readiness means the service can complete a fresh transaction, not merely that a new process exists. Check that bounded queues remain bounded while clients retry, and that repeated restart attempts do not create a second memory-pressure problem.
6. A hypothetical gateway investigation
Suppose a telemetry gateway slows during an approved reconnect burst. Its test record shows new high events and increased memory stall time, but no OOM event or kill. The queue drains afterward and the post-burst memory floor returns to its previous range. This hypothetical evidence supports testing admission control and the burst budget before opening a leak investigation.
Now suppose equivalent bursts instead leave successively larger anonymous-memory floors after the queue empties. That changes the next step: identify retained objects and compare ownership against completed requests. If a later test ends in a kill, separately establish whether the local budget, an ancestor, or system-wide exhaustion selected the victim. The enforcement outcome and the growth explanation are different questions.
7. Release with a bounded acceptance record
Accept a configuration only when approved workloads meet response requirements, overload has a defined containment outcome, and recovery completes without losing required state. State the tested concurrency, traffic profile, swap arrangement, kernel build, and limit hierarchy. Hold release when an unexplained termination remains, when the collector loses the decisive interval, or when a larger limit merely postpones continuing growth. The deliverable is an evidence-backed memory policy, not a reassuringly low graph.