irqsoff Tracing: Find the Critical Section That Blocks Interrupt Progress
Use irqsoff tracing to identify the beginning and end of an interrupt-disabled interval, then inspect the work performed inside it. A device missing its deadline does not by itself prove interrupts were masked. The diagnostic needs to connect a particular CPU, critical section and workload phase to the response requirement.
The baseline is upstream Linux v6.12 with irqsoff present in the running kernel’s available tracers. The relevant configuration depends on architecture support for interrupt-state tracing. No tracer was enabled and no interrupt-stall fixture was executed here; the procedure is for an approved, recoverable diagnostic target.
Define the latency question precisely
Write down which device response is late, which CPU normally handles it and the allowed budget. Separate interrupt delivery, handler execution, deferred work and application scheduling. irqsoff observes time with ordinary interrupts disabled; it does not measure the whole device-to-application response path.
List the relevant interrupt routing and CPU affinity. A long interval on an unrelated CPU may be interesting without explaining this device’s late response. Conversely, interrupt migration can make a one-CPU capture miss the relevant instance. Keep the routing configuration with the trace.
The v6.12 ftrace reference explains that the default irqsoff workflow retains the trace for a newly observed maximum interval. A maximum-search trace is not a census of every masked interval, and the largest observed interval is not a proven worst-case bound.
Take ownership of a bounded tracing session
Inspect the actual tracefs mount and available controls. Save existing tracer, recording state, CPU mask, latency threshold, maximum value and function-trace setting. Coordinate with other tracing users; a shared configuration change can disrupt their evidence. Do not assume every tracer supports the same instance behavior.
Archive any existing trace before clearing or resetting a diagnostic window. For a fresh maximum-search experiment, the documented controls select irqsoff, use tracing_max_latency to reset the maximum, and use tracing_on to delimit recording. A nonzero tracing_thresh changes latency-capture policy, so record or intentionally reset it rather than inheriting an unknown threshold.
Begin with function tracing disabled if start/end evidence can answer the question. More detailed function recording adds observation cost. Record each planned control change before applying it and prepare its restoration. These are control semantics, not a shell script executed against the current machine.
Capture one representative operation
- Confirm the normal workload completes and the diagnostic log destination is functioning.
- Prepare the tracer while recording is stopped, then start the bounded window with the intended maximum/threshold policy.
- Run the smallest workload that preserves the delayed response and record its operation identity.
- Stop recording promptly and save the trace, maximum-latency field and effective settings together.
- Restore the previous tracing policy after collection, accounting for any other authorized session.
Stopping ring-buffer writes does not necessarily remove every tracing overhead. The reference explicitly distinguishes the recording switch from all instrumentation cost. Use a genuinely uninstrumented or appropriately restored baseline when comparing production timing.
Annotate start, end and the saved stack
Use a synthetic worksheet to avoid reading the last visible function as the cause:
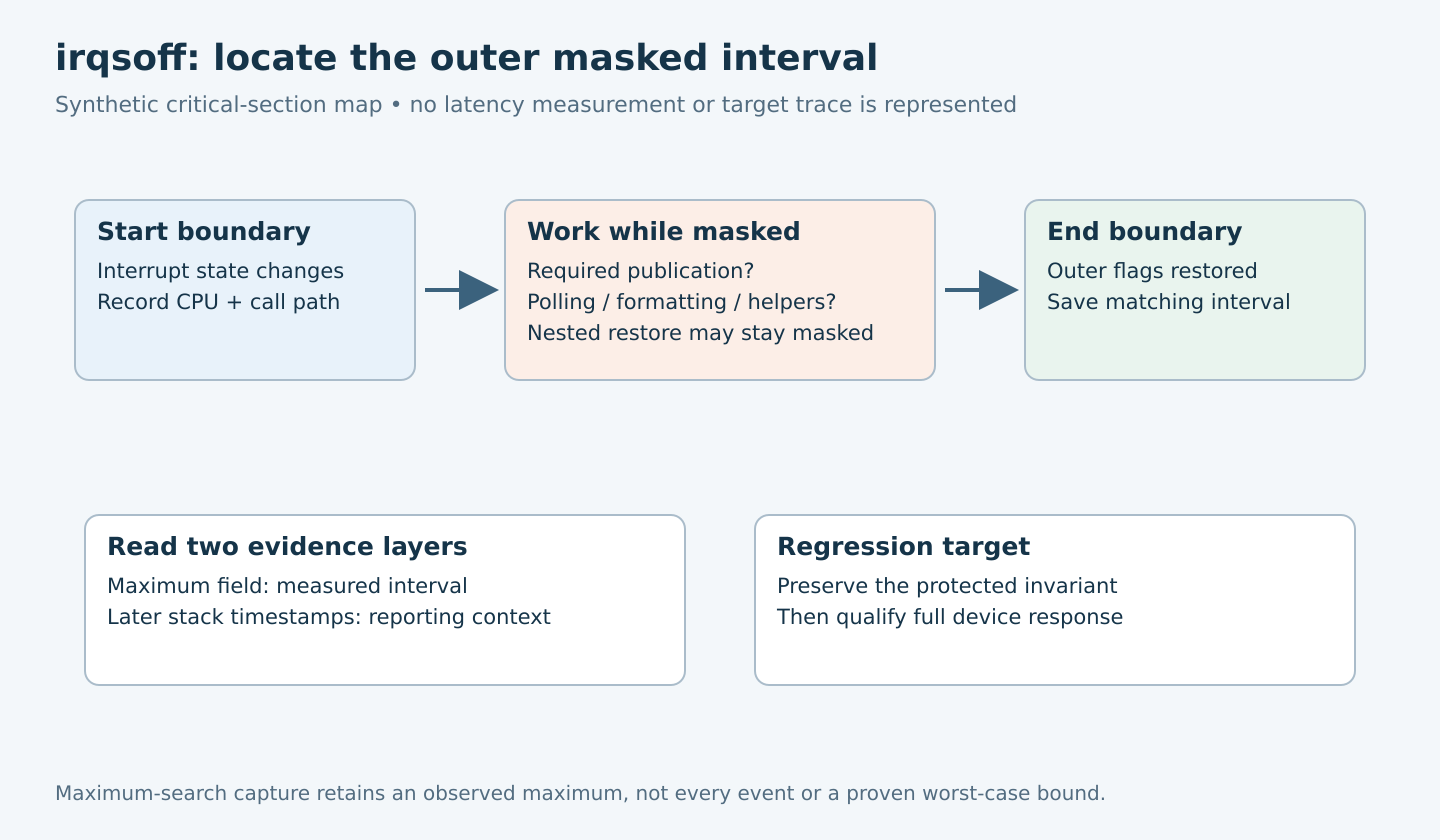
- Reported CPU: the CPU whose interval the trace describes.
- Start location: where the relevant outer interrupt-disabled interval begins.
- End location: where that interval closes, often through a flags-restoration path.
- Saved stack: the call chain associated with capture, interpreted against the exact build.
- Maximum field: the tracer’s measured interval, with its documented units.
For a hypothetical driver, the start might be a lock-and-mask operation in commit_batch and the end its matching unlock/restore operation. Audit every operation between them: descriptor preparation, retry loops, register polling, logging and calls into helpers. Identify which work truly requires interrupts to remain masked.
Trace timestamps printed after the critical interval can include reporting activity. Do not substitute the timestamp of a later stack-dump line for the maximum-latency value. The documentation’s examples explicitly show that recorded lines and the saved maximum need not end at the same displayed timestamp.
Add detail only when the first trace leaves a question
If the start/end chain is too broad, repeat with the supported function-trace option and a controlled reproduction. Compare whether the workload and maximum change materially. A detailed trace that greatly lengthens the interval is useful for path discovery but not automatically a production latency measurement.
Keep nested interrupt-disable operations in context. An inner restore can preserve an already-disabled outer state; it need not end the measured interval. Review the complete flags ownership and matching outer boundary rather than counting API names in one helper.
Nonmaskable activity or firmware interference can lengthen elapsed time without appearing as ordinary function work in the captured region. A sparse trace is therefore not proof that the CPU executed nothing. Record unexplained gaps instead of assigning all elapsed time to the nearest driver line.
Repair the critical-section contract
Move preparation or formatting outside the masked interval only when the data remains valid. If a snapshot is taken under a lock, specify how lifetime and concurrent updates are handled after release. Splitting a critical section without preserving its invariant can exchange a latency defect for corruption.
For the hypothetical batch commit, consider preparing descriptors before acquiring the lock, leaving only the bounded publication step inside. Verify cancellation and error exits, including paths that return while preserving the prior interrupt state. Do not introduce a sleeping wait into an atomic section to make the trace look calmer.
Close against the actual device budget
Repeat the original workload with the corrected source, then measure the device’s complete response on a production-like build. A shorter IRQ-disabled interval supports one part of the explanation; it does not establish that deferred work or scheduling now meets its deadline.
Deliver the saved maximum trace, source-backed interval boundaries, effective settings, observation-cost comparison and unresolved coverage. The acceptance claim should name the tested CPU and workload. An absent irqsoff warning or a favorable observed maximum is not a universal latency guarantee.