Kernel Trace Buffers: Detect Lost Events Before Drawing a Causal Timeline
Qualify the capture before using a missing trace event to explain a product failure. Save per-CPU loss statistics, enabled event filters, clock selection and reader behavior with the trace. A gap can mean the operation never happened, but it can also mean the recorder did not retain or deliver it.
This guide uses upstream Linux v6.12 live tracefs ring buffers. It does not describe persistent pstore ftrace, nor promise that a timestamp-ordered file is a complete causal history. No tracing workload or buffer-overflow experiment was executed here.
Write a capture manifest
Record the kernel build, active tracer, enabled event set, per-event filters, CPU mask, selected clock, per-CPU buffer sizes, overwrite policy and every process reading the stream. Add the reproduction’s start/end markers and completed-operation count. A trace without this manifest leaves too many explanations for missing evidence.
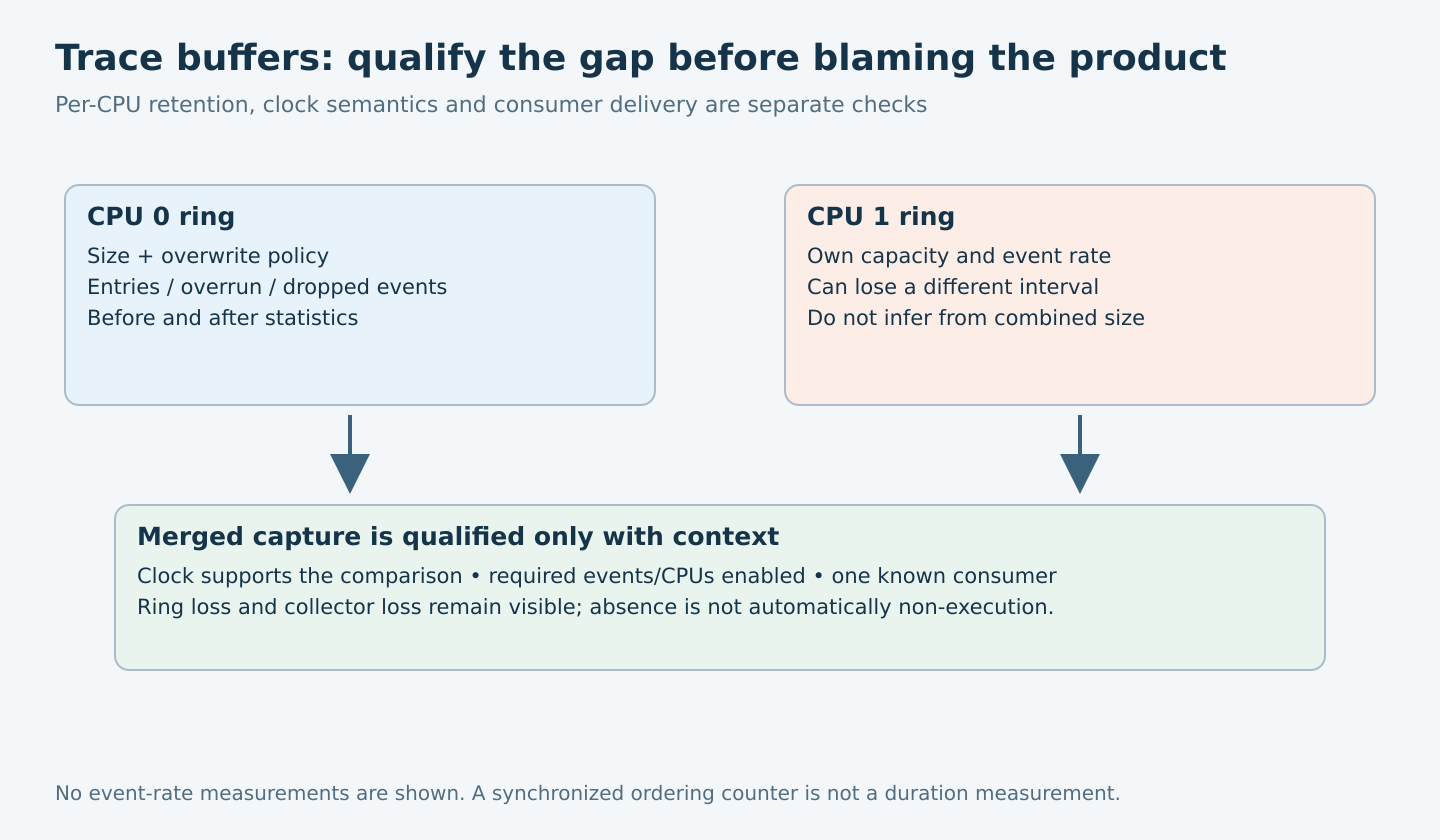
The v6.12 ftrace documentation defines separate buffers for CPUs. The top-level buffer_size_kb describes per-CPU capacity when uniform, while buffer_total_size_kb reports combined capacity. Unequal buffers need individual inspection. A large total cannot protect one busy CPU’s small buffer from overrunning.
Keep capacity in bytes or kilobytes rather than inventing a fixed event count. Event records have different sizes, and selected payloads and metadata affect retention. Verify the actual allocation and memory budget before increasing buffer sizes.
Distinguish old-event overwrite from new-event rejection
When overwrite mode is enabled, a full buffer discards older events to retain newer ones. With overwrite disabled, new events can be rejected once capacity is exhausted. The policy chooses which part of the interval can be lost; it does not make the capture lossless.
Read each participating CPU’s stats file at controlled boundaries. The documented fields distinguish entries still retained, overwrite overruns, commit overruns and dropped events when overwrite is off. Capture counter baselines and final values so earlier diagnostic activity is not attributed to the current run.
| Observation | Meaning to investigate | Invalid conclusion |
|---|---|---|
| Overrun increased | Older records were overwritten | The missing earlier operation never happened |
| Dropped events increased | New records were rejected under non-overwrite policy | The workload stopped producing events |
| Commit overrun is nonzero | Nested recording exceeded available buffer conditions | Ordinary stream completeness is established |
| No recorded loss counters increased | These recorded loss mechanisms were not observed | All required events were enabled and executed |
Identify which reader owns the records
trace_pipe is a consuming live interface. Reading records removes them from that stream; another consumer cannot assume it will receive a duplicate complete copy. A diagnostic tool left running can explain why a later manual read appears empty.
The ordinary trace interface is non-consuming, but reading while tracing continues can produce an inconsistent moving view. For a bounded snapshot-style experiment, stop recording at the agreed boundary before collecting the stable retained trace. Preserve existing records before any operation that clears them.
Track collector buffering, process exits and output-file errors separately from kernel-ring loss. A zero ring overrun count cannot prove the consumer wrote every byte to disk. If the collector parses or compresses data, retain its error counts and enough raw evidence to audit dropped or malformed records.
Choose a clock that supports the intended comparison
The selected trace_clock is shown in brackets in the available-clock list. A fast local clock can lack cross-CPU synchronization on some systems. Sorting those timestamps can create a false order when a task migrates or when two CPUs exchange work.
Choose an available clock with the documented properties needed by the investigation, and record its cost and units. A synchronized counter can establish an observation order but is not a duration clock. Conversely, a duration-capable clock does not make two different instrumented events identical to the exact semantic moments the application cares about.
Do not switch clocks midway through a capture and merge the output as one continuous timeline. Stop, archive and establish a new run. Correlating trace time with external instruments also requires an explicit alignment method; similar-looking decimal timestamps are not enough.
Validate the recorder with a controlled event-rate experiment
- Select an available, understood event and a bounded workload that creates an independently countable sequence.
- Capture at a low rate using the exact intended CPU mask, filters, clock and consumer.
- Compare retained event identities with the independent operation ledger, allowing for the event’s real semantics.
- Increase only the relevant event rate or capture duration on the recoverable test system and inspect per-CPU loss changes.
- Choose a recording window, event subset and capacity that preserve the evidence needed for the actual diagnosis.
The independent ledger is essential. If the event means “attempted submission,” it cannot be equated with completed requests. Include operation identities when the selected event exposes them and document where it does not. Do not fabricate a one-to-one relationship merely to obtain a convenient expected count.
Interpret the product timeline with confidence labels
Mark intervals as retained with known configuration, affected by recorded loss, or unqualified because setup or consumer state is missing. Keep per-CPU gaps visible. A global merged file can hide the fact that one CPU lost its entire useful prefix while another retained every event.
For a hypothetical driver completion investigation, a submission without a matching completion is meaningful only after checking that both event types were enabled, the operation identity is stable, the completion CPU was covered and the interval was retained. If one condition fails, the next action is a better capture rather than immediately changing the driver.
Close with an evidence budget
Deliver the manifest, raw trace, per-CPU before/after statistics, collector status and the event-rate qualification result. State which required transitions can be observed and how much relevant history the chosen workload retained. Report observed capacity without turning it into an unrestricted throughput promise.
The strongest causal explanation survives these capture checks. A trace’s precision comes from knowing what was recorded, what could be lost and what its clock can compare, not from the number of lines in the file.