KGDB on Embedded Linux: Account for the Hardware That Keeps Running While CPUs Stop
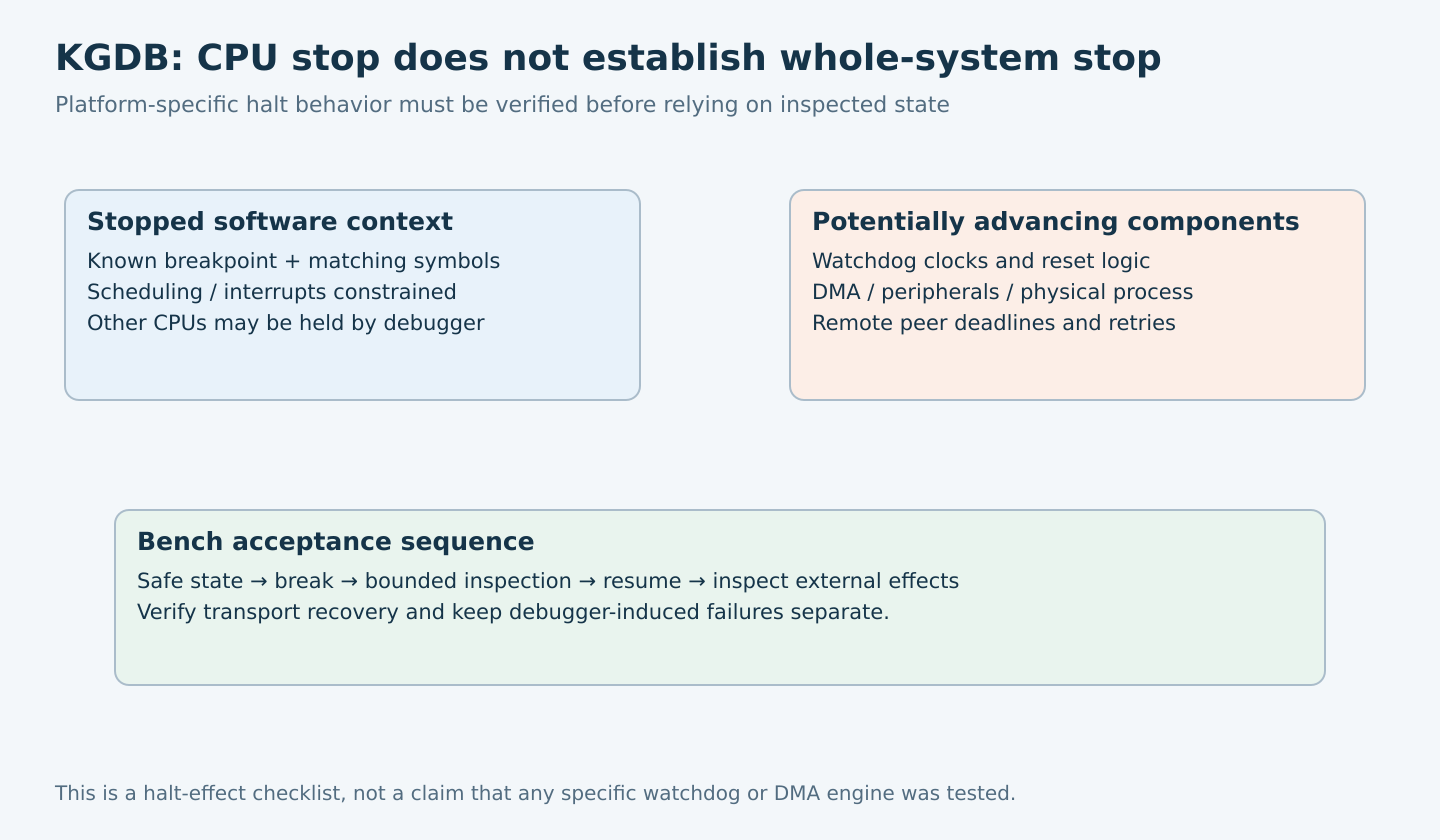
Before stopping Linux in KGDB, identify everything that does not stop with the CPUs. A debugger can freeze software progress while a watchdog, DMA engine, peripheral or remote peer continues to advance. The resulting timeout, buffer change or reset may be caused by the debugging session rather than the original defect.
This guide uses upstream Linux v6.12 KGDB and its documented serial-console transport. Actual halt behavior remains specific to the SoC, firmware, peripheral and debugger architecture support. No debugger connection or breakpoint test was performed here. Use an isolated bench system with controlled loads and an independent recovery route.
Confirm the debug image and transport
The v6.12 KGDB guide describes the required kernel support, symbol-rich vmlinux and I/O-driver selection. Match the debugger’s symbols and modules to the target image. A plausible source line from a nearby build is not a reliable breakpoint location.
For kgdboc, verify the actual serial device, baud rate and driver polling support. A UART that works through its ordinary interrupt-driven console path is not automatically qualified for debugger polling. Record cabling, voltage-domain compatibility and how the host hands the port between terminal software and GDB.
Early boot debugging requires a suitable built-in I/O driver. Loading that driver later cannot make kgdbwait observe an earlier initialization failure. Confirm where the transport becomes usable and keep an independent early-boot capture for the preceding interval.
Choose breakpoint support without weakening the normal image
Review architecture support for software and hardware breakpoints. Kernel read-only/executable memory protections can constrain software breakpoint insertion; the KGDB documentation identifies this interaction. Prefer a supported hardware-breakpoint route where appropriate, and treat any debug-image security change as a separately reviewed configuration decision.
Keep the production image and its security settings reproducible. Do not quietly deploy a weakened debug configuration as a permanent fix for debugger convenience. Record the exact changes in the diagnostic build and the reason each is necessary.
Also verify the entry mechanism. kgdboc does not generally support interrupting the target through an ordinary GDB remote-protocol interrupt alone; its documented workflow needs an appropriate target-side entry or console proxy. Plan that entry before the system reaches a state where interactive access is unavailable.
Make a halt-effect map
| Component | Question during the stop | Evidence needed |
|---|---|---|
| Watchdog | Does its clock continue, and who can service it? | Actual watchdog/debug-freeze behavior and independent reset observation |
| DMA or autonomous peripheral | Can it keep modifying memory or producing output? | Device state, buffer ownership and platform-specific halt behavior |
| Remote protocol peer | Will it time out, retransmit or change session state? | Peer-side log aligned with debugger stop/resume |
| Physical process | What happens while control software makes no progress? | Safe isolated load or external containment |
These are questions to verify, not claims that every platform behaves identically. Some hardware has debug-freeze controls, some does not, and some controls affect only selected timers. A CPU halt alone is insufficient evidence for any of them.
Prepare a safe observation point
Choose a breakpoint after the target has reached a known quiescent state, before experimenting inside active I/O. Stop autonomous producers through their normal reviewed interface when that is necessary for safe inspection. Confirm the stop completed rather than assuming that a command request immediately stopped hardware.
A debugger memory window is not automatically a stable snapshot if a bus master can still write that memory. If examining a descriptor ring, identify which descriptors remain hardware-owned. A changing value can reflect legitimate autonomous activity, and an unchanged value can merely reflect a stopped producer.
Do not call arbitrary target functions from the debugger to obtain a convenient answer. A function may require scheduling, interrupts or a lock held by another stopped CPU. Prefer direct inspection of understood state, and document where that state is not coherent without the ordinary synchronization protocol.
Qualify break, inspect, resume and recovery
- Boot the exact diagnostic image and prove a normal operation before setting the breakpoint.
- Stop at a known benign location with the physical workload isolated. Confirm debugger responsiveness and symbol correctness.
- Observe the external components for a bounded interval chosen from their verified behavior.
- Resume and inspect watchdog status, device errors, peer timeouts and application state before continuing ordinary traffic.
- Exercise the recovery route if the session loses transport or cannot resume safely.
The purpose is not to prove that the product can tolerate an unlimited halt. It is to establish which diagnostic windows are usable and which effects must be expected. If a watchdog can reset before the intended inspection finishes, redesign the bench plan with the platform owner rather than repeatedly losing evidence.
Separate debugger-induced effects from the original symptom
For a hypothetical networked acquisition device, stopping after arming DMA could let samples continue arriving while software stops returning buffers. A peer might independently close the connection. On resume, the device could report an overrun and a reconnect that did not occur in the original unhalted failure.
Record the breakpoint and stop duration with those effects. Repeat the original workload without a stop, using lower-intrusion evidence where possible. Do not attribute post-resume errors to the driver solely because they appear near the source line under investigation.
Conversely, a bug disappearing under single-step execution does not demonstrate correctness. The debugger changes interleaving and timing, and can prevent the very race the investigation needs to observe. Use the halted state to form a source-level hypothesis, then test that hypothesis under realistic execution.
Deliver a qualified debugging procedure
The handoff should include the exact image and symbols, transport entry/exit process, breakpoint restrictions, halt-effect map, safe observation points and recovery steps. State which peripherals and peers were observed during the stop and which remain unknown.
A successful KGDB session is one that yields interpretable state and returns the bench to a known condition. It does not establish that CPU stop equals system stop, or that every event after resume belongs to the original product failure.