Linux Lockup Detector Coverage: Check Which CPUs and Progress Signals Are Actually Monitored
Build a per-CPU detector coverage map before interpreting the absence of a lockup warning. Confirm the selected detector backend, runtime enablement, online CPUs and watchdog CPU mask. A latency-sensitive isolated CPU can be outside the default observation set even while the rest of the machine reports healthy progress.
This guide uses upstream Linux v6.12. It focuses on kernel softlockup and hardlockup observation, not hardware-watchdog servicing or pstore retention. No CPU was deliberately stalled and no detector threshold was changed here. Controlled negative tests require a disposable target, independent capture and recovery.
Identify the actual hardlockup backend
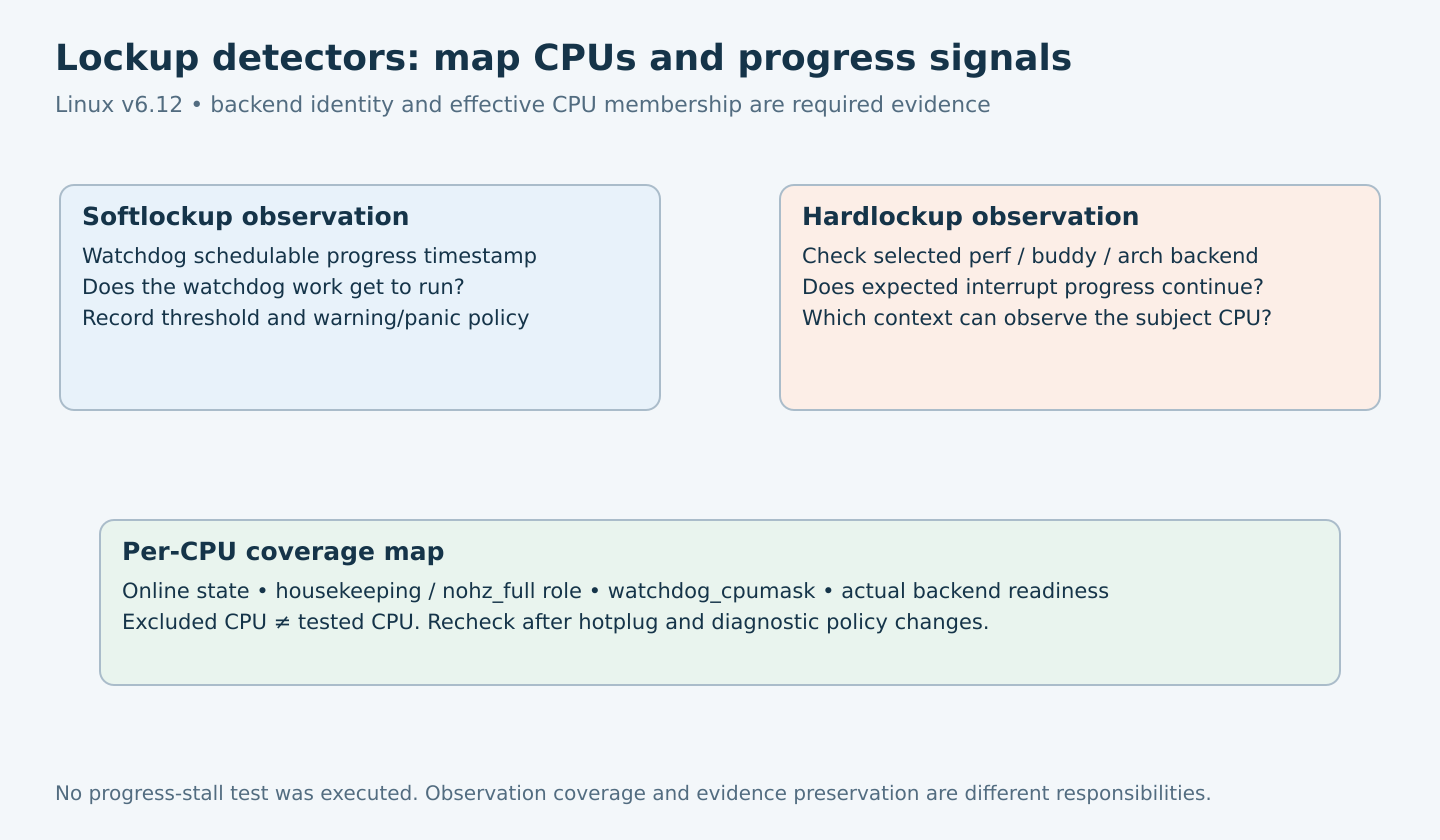
The v6.12 configuration includes perf-based, buddy-CPU and architecture-specific hardlockup implementations. Do not assume the name nmi_watchdog proves that every target uses the same NMI/perf mechanism. Inspect the final configuration and startup messages for support and initialization failures.
For the perf-based model, the lockup-detector guide describes an NMI/perf observation of hrtimer progress. A buddy detector instead depends on another CPU’s timer-side observation. Architecture-specific implementations need their own source review. The identity of the observer matters when the failure can affect several CPUs together.
Record software configuration separately from actual readiness. A requested detector can fail to obtain its required resources or be disabled through runtime or boot policy. Preserve those conditions instead of treating a configured symbol as proof of active coverage.
Separate the two progress signals
Softlockup checking asks whether the watchdog’s schedulable work has refreshed its progress timestamp. Hardlockup checking in the documented common model asks whether expected hrtimer interrupt progress continues. A CPU can therefore satisfy one observation while failing the other.
The guide describes softlockup detection relative to twice watchdog_thresh and a related hrtimer sampling interval. These relationships belong to the selected implementation, not a promise of exact wall-clock warning time under all failures. Preserve the configured threshold and actual backend when interpreting timing.
Detection, reporting, panic and reboot are separate policies. Record the effective panic controls and kernel panic timeout. A warning-only campaign and a panic-producing campaign have different evidence and recovery consequences even if they detect the same missing progress.
Map online, isolated and monitored CPUs
Collect the online CPU set, nohz_full boot configuration, watchdog CPU mask and the affinity of the suspected workload. The documentation states that NO_HZ_FULL systems exclude full-dynticks CPUs from watchdog execution by default, retaining housekeeping CPUs. This avoids introducing watchdog ticks that defeat the isolation goal.
Use a row for every relevant CPU: online status, housekeeping/full-dynticks role, workload role, requested watchdog membership, effective detector status and observation source. Distinguish “excluded by policy” from “unsupported” and “requested but initialization failed.”
The v6.12 watchdog implementation coordinates the watchdog masks and per-CPU operation. Recheck the map after CPU hotplug or policy changes. A mask saved before a test does not establish the same coverage after a CPU goes offline or is reassigned.
Use a synthetic coverage worksheet
| Hypothetical CPU role | Coverage question | Interpretation of silence |
|---|---|---|
| Housekeeping CPU running watchdog work | Were both configured progress checks active? | Limited by detector/backend and report delivery |
| Full-dynticks application CPU excluded from mask | Was exclusion intentional for latency isolation? | No detector claim for that CPU from this policy |
| CPU requested in mask but not online | When did online membership change? | Requested coverage is not active execution |
| CPU observed by another CPU’s buddy mechanism | Can the observer still make progress in the failure? | Depends on the observation chain, not just the subject CPU |
No CPU numbers or test outcomes are asserted by this worksheet. Fill it from the actual image and deployment policy. In particular, do not claim that every isolated CPU is excluded by every kernel configuration without checking its effective mask.
Qualify progress tests without damaging a working system
- Confirm normal workload progress and report collection on each intended CPU.
- Use a reviewed, bounded development fixture to suppress the relevant progress signal on one CPU at a time.
- Prepare independent recovery before any fixture that may stop interrupt or scheduling progress.
- Record the subject CPU, observer/backend, trigger time, first warning and configured panic behavior.
- Restore the original configuration and verify the ordinary workload and CPU map afterward.
The fixture must distinguish scheduler starvation from interrupt-progress loss. A generic busy process in userspace is not automatically a valid kernel softlockup or hardlockup test. Do not disable interrupts on a production CPU merely to see whether a warning appears.
If extending watchdog coverage to an isolated CPU is useful for a laboratory diagnosis, document the changed timer and scheduling disturbance. The experiment can answer a coverage question while no longer representing the production isolation configuration. Compare performance only with that distinction visible.
Investigate missed warnings as a chain
When a suspected lockup produces no record, check CPU membership, backend initialization, progress semantics and evidence delivery before changing thresholds. A direct reset can occur before a report is preserved. A stalled observer can fail to report a stalled subject. A detector can also remain healthy while the application waits on a resource it does not monitor.
For a hypothetical control service pinned to a full-dynticks CPU, a warning on a housekeeping CPU does not automatically describe the control CPU. Correlate each warning’s context with the map and workload before assigning the fault. Preserve uncertainty where the recorded stack belongs to an observer rather than the original blocked activity.
Close the coverage gap explicitly
Deliver the CPU map, selected backend, final configuration, runtime settings and one result per tested progress condition. State which CPUs or failure classes remain outside observation and why. A valid product decision may retain limited coverage for latency reasons, but that limit must be intentional.
The useful conclusion is a bounded statement about monitored progress on specified CPUs. A quiet machine or an empty crash archive is not, by itself, evidence that every CPU remained schedulable and interrupt-responsive.