OS Noise Tracing: Attribute Missing CPU Time in a Latency-Sensitive Linux Task
Use osnoise to classify interruptions of a per-CPU measurement loop, then investigate the dominant observed source with a focused trace. The result describes interference during that loop’s sampling window. It is not a direct measurement of every application’s lost execution time, and a large hardware-classified count is not automatically proof of faulty hardware.
This workflow is pinned to upstream Linux v6.12. It addresses noise attribution rather than finding the longest IRQ-disabled critical section or measuring a timer’s wakeup latency. No tracing controls were changed and no osnoise workload was started for this article. The example accounting below is synthetic.
Define the experiment before starting the tracer
Identify the latency-sensitive workload, its CPUs, scheduling policy and the operation that misses its service target. Decide whether the goal is to observe the same loaded environment or compare an idle baseline with controlled load. Record affinity, interrupt routing, virtualization and power-management context without changing them all at once.
Check CONFIG_OSNOISE_TRACER and the available tracer list. The v6.12 Kconfig describes the generated measurement workload and its source counters. Use an approved development environment with a recovery route. The tracer consumes CPU time and affects scheduling; it should not be introduced casually into a live control workload.
The osnoise guide lists cpus, period_us and runtime_us in the tracefs osnoise directory. Select the smallest relevant CPU set and a bounded duration. Keep runtime within the period, record the actual accepted values, and avoid interpreting a lightly sampled configuration as continuous coverage.
Keep workload and interrupt options explicit
In ordinary workload mode, osnoise repeatedly reads time while allowing preemption, interrupts and softirqs, so it can observe interference from those sources. NO_OSNOISE_WORKLOAD changes the experiment: tracepoints can still describe execution, but the regular generated sampling workload is absent.
The options that disable preemption or interrupts intentionally remove classes of interference and alter the target’s behavior. They are not neutral ways to make a noisy result look cleaner. Keep them out of the initial comparison unless a separate, reviewed experiment specifically requires that narrowed scope.
Record the actual tracefs file tracing_thresh, which determines the minimum sampled time gap considered noise. The v6.12 osnoise guide calls it tracing_threshold, but trace.c registers tracing_thresh; use the implementation spelling. The osnoise sampling code uses a 1000-nanosecond fallback when the value is zero, rather than an infinitely sensitive detector. Stop thresholds can freeze tracing on a large single or total noise event, but PANIC_ON_STOP is a separate consequential option. Do not enable it for this ordinary capture procedure.
Read counts separately from durations
The per-period summary provides sampled runtime, total observed noise, available-CPU percentage for the measurement thread, maximum single noise and source counters. Counters classify occurrences of hardware-related gaps, NMIs, IRQs, softirqs and threads where their hooks apply. With CONFIG_PREEMPT_RT, v6.12 does not install the separate softirq hooks because softirqs execute as threaded work; interpret the resulting activity through the applicable thread context instead. These counters are not five duration totals.
A source with many short occurrences may consume less time than one long interruption from another source. Do not rank root causes solely by the largest count. The maximum single gap can matter more to a deadline than the average available percentage, while cumulative interference can matter more to throughput.
The hardware classification means the sampling loop observed a gap without a corresponding tracked operating-system interference. The implementation includes hypervisor interference in that category. In a guest, host scheduling can therefore resemble hardware noise. This classification does not name a particular SMI handler, firmware defect or physical component.
Use events to explain a selected noisy interval
Enable only the relevant osnoise events for a bounded capture, such as sample_threshold, irq_noise, softirq_noise, thread_noise and nmi_noise where supported. Preserve CPU, start time, duration and source identity, then relate them to the particular sampled gap. Events from a different period or CPU do not explain the selected sample merely because their timestamps are nearby in a merged display.
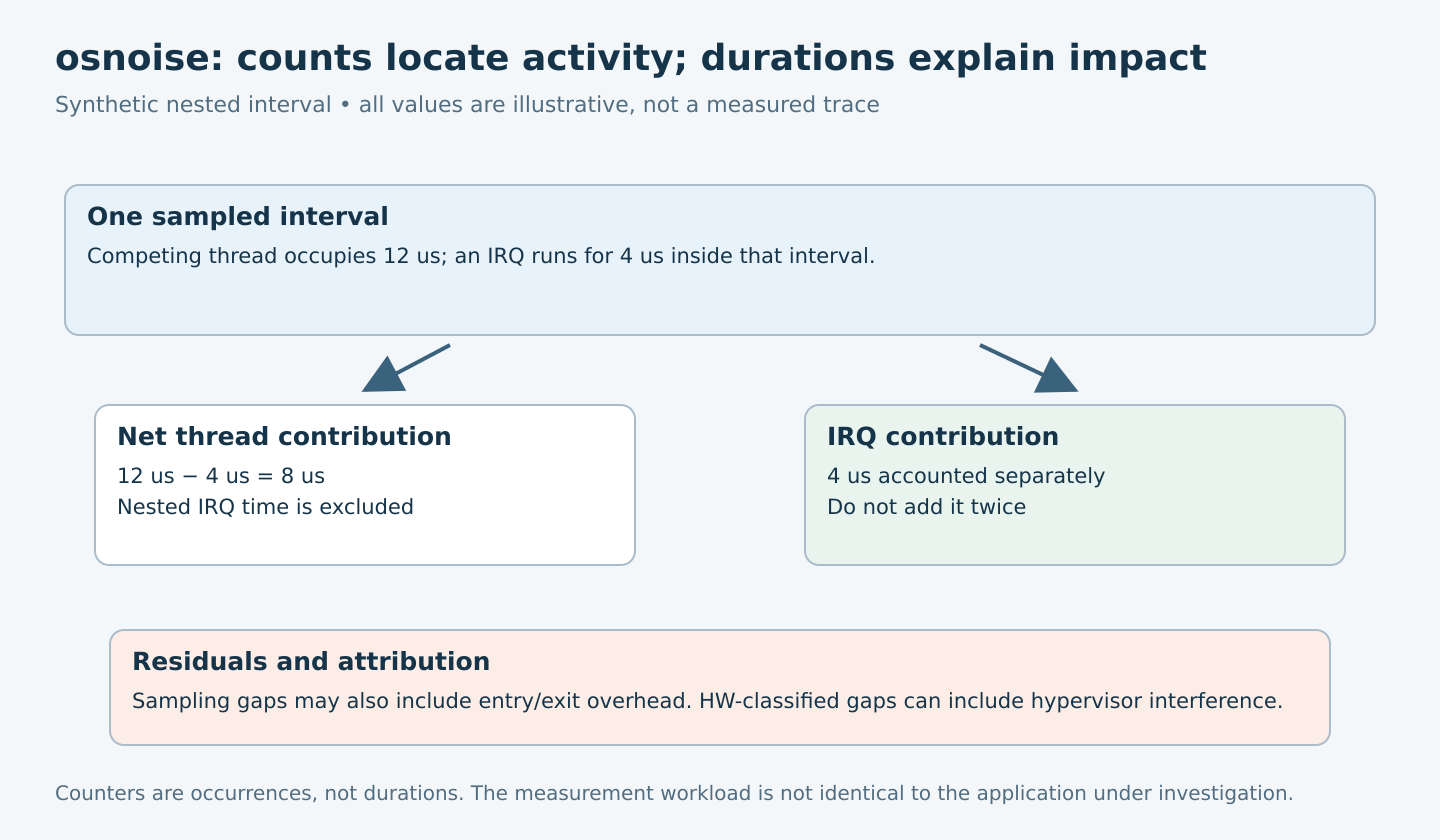
Event durations use net accounting to avoid counting nested interference twice. For a synthetic example, another thread occupies a 12-microsecond interval, within which an IRQ runs for four microseconds. The corresponding net thread contribution would be eight microseconds and the IRQ contribution four, before considering instrumentation boundaries and other overhead.
Do not add a gross thread interval to the IRQ duration again. Equally, do not demand exact equality between summed event durations and the sampling-loop gap: entry/exit code and measurement overhead can account for a residual. Retain both views instead of forcing them to agree by inventing an unobserved event.
Apply a source-driven decision procedure
| Correlated observation | Next bounded investigation |
|---|---|
| One named IRQ dominates duration | Handler work, interrupt rate and the actual route to the affected CPU |
| Softirq work dominates | Relevant subsystem backlog and the workload producing it |
| A competing thread dominates | Its scheduling policy, affinity and required execution |
| Unattributed gaps dominate | Virtualization and platform-level evidence, without naming an unsupported cause |
| Counts rise but deadline misses do not | Whether occurrence count is actually the relevant service constraint |
Choose one intervention justified by that evidence. For example, investigate whether a specific handler is doing avoidable work before broadly moving every interrupt. Preserve the same workload definition and CPU set for the comparison, and separately verify that any routing change does not overload another CPU.
Protect the capture’s evidential value
Save the full tracer configuration, event selection and per-CPU buffer-loss statistics with the trace. A summary can survive while the event details needed to explain it are overwritten. If those events are missing, classify the interval as incompletely attributed rather than filling the gap from an average.
Use exclusive ownership or a supported isolated tracing instance so another observer does not silently change configuration or consume the same stream. At the end, stop the measurement workload and restore the prior settings that the experiment changed. The proposed sequence has not been executed on a target here.
Validate the service, not just the tracer
After a correction, compare the same noise fields and application-level timing. A lower osnoise maximum is useful evidence, but the application may have different priority, blocking behavior or CPU placement from the sampling thread. It still needs its own end-to-end deadline test.
Deliver the selected noisy interval, source-duration interpretation, known residuals and controlled before/after procedure. The successful conclusion is an attributable interference mechanism with a validated service effect. A clean-looking summary without coverage, event integrity and workload context is not a real-time guarantee.