Intermittent RTOS Crashes: Logging, Core Dumps and a Reproducible Test
An intermittent RTOS crash becomes easier to investigate when the device preserves the right evidence before it restarts. Adding more console output after every failure often changes task timing without answering the basic questions: which build failed, which execution context stopped progressing and what happened immediately beforehand?
This workflow applies to MCU systems using an RTOS. Architecture-specific exception registers, retained RAM and dump support must be selected for the actual chip and software release. The examples are diagnostic designs, not reports of measured failures on an Obeita product.
1. Classify the symptom before calling it a crash
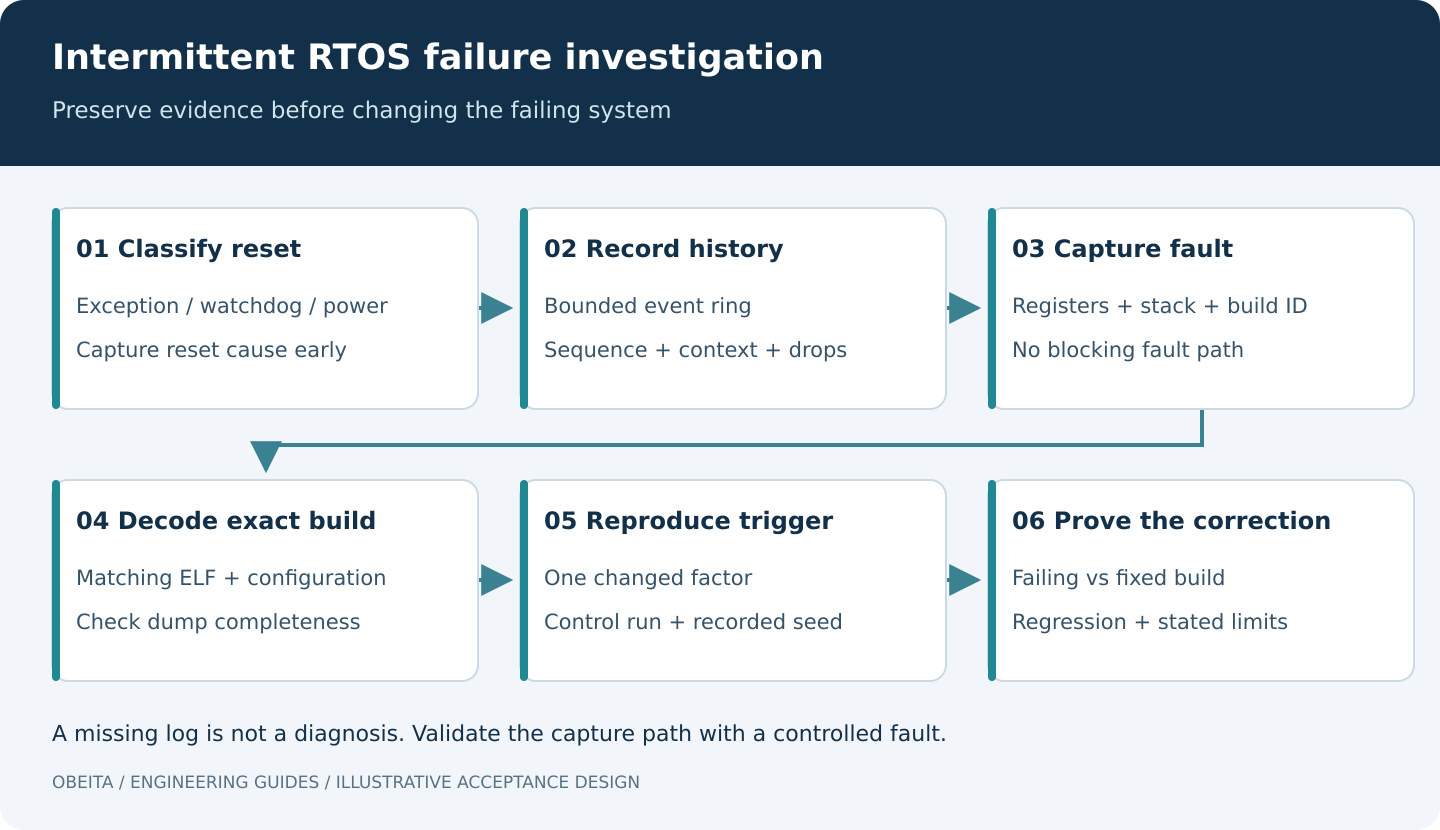
Separate a CPU exception, watchdog reset, brownout, explicit software restart and application hang. A device that still services interrupts but no longer processes a command has a different failure from one that loses its supply. Capture the reset-cause register as early as the platform permits, before startup code clears it, and document how multiple cause bits are interpreted.
Keep the original build, its ELF or equivalent debug image, linker map, configuration and compiler details. A program counter decoded against a later binary can point to a convincing but unrelated source line. Include a build identifier in both the boot banner and persisted diagnostic record, and store the corresponding artifacts outside the device.
At the same time, obtain a power trace and an external indication of execution where practical. A GPIO heartbeat observed by a logic analyzer can show whether software stopped before a supply collapse. Do not assume that every reset with missing logs is an RTOS scheduler defect.
2. Build a bounded event history
A compact ring buffer is often more useful than unrestricted text output. Record a monotonic timestamp or tick, event ID, task or interrupt context, transaction sequence and a small argument field. Log state transitions such as request queued, DMA started, completion observed and buffer released. Avoid recording every byte when the problem concerns ownership transitions.
Choose an explicit concurrency model. A single-producer buffer and a multi-producer buffer need different synchronization. Interrupt writers must not wait on a mutex held by the interrupted task. On multicore devices, local interrupt masking alone does not serialize other cores. Prefer the platform’s supported tracing or logging facilities unless a custom logger has its own correctness tests.
Document buffer wrap, drop count, timestamp wrap and overflow policy. Zephyr’s logging subsystem offers immediate and deferred processing modes with configurable buffering behavior. These options change execution context and latency; enabling a logger does not make its timing cost disappear. Review the Zephyr logging documentation for the exact release being built.
3. Preserve a minimal fault snapshot
Capture the exception reason, relevant CPU registers, active execution context and enough stack information to reconstruct the failing path. On supported Cortex-M implementations, fault-status registers and the exception stack frame are useful; register availability and stack-frame layout vary with core features and exception state. Use the vendor’s architecture-specific handler rather than copying a universal HardFault snippet.
The fault handler must not depend on the component suspected of failing. Allocating memory, acquiring a normal mutex or printing through a complex driver can turn the original exception into a second failure. Keep capture bounded, mark incomplete records and design for a reset occurring halfway through storage. Flash writes inside a fault path require particular care about execution location, power and driver state.
When using ESP-IDF, its core-dump facility can save task context to a configured destination and supports analysis with the matching build. Dump coverage and storage requirements depend on configuration. A successful dump does not guarantee that every buffer of interest was captured. Follow Espressif’s core-dump instructions and verify extraction on the target.
Zephyr also provides configurable core-dump backends and memory coverage. Its offline workflow uses the dump together with the application ELF. These are separate platform implementations; do not mix their commands or assume identical data formats. See the Zephyr core-dump guide.
4. Make hangs observable without waiting for an exception
Some deadlocks never trigger a CPU fault. Track progress at meaningful boundaries: a completed acquisition, consumed work item or successfully advanced state machine. A task that merely updates a heartbeat at the top of a loop can appear healthy while its useful work is permanently blocked.
Let a supervisor evaluate required progress before servicing the hardware watchdog. Document which tasks are required in each operating mode and how long legitimate operations may take. Otherwise a firmware update, radio calibration or deep-sleep transition can look like a hang. Avoid letting an unrelated timer interrupt feed the watchdog regardless of task health.
On a diagnostic build, include queue occupancy, allocation failures, task states and observed stack margins in periodic snapshots. Capture these at a controlled rate. A decreasing free-memory value suggests a line of investigation; it is not enough by itself to prove a leak, especially when caches or pools are intentionally warming up.
5. Turn the field description into a controlled trigger
Create a reproduction sheet containing board revision, build hash, supply settings, peripheral firmware, input data, random seed, command sequence and elapsed time. Preserve the failing traffic or input trace when permitted, removing credentials and unnecessary personal data before sharing it.
- Load interaction: combine the relevant producers, then increase one rate at a time. Record actual offered and accepted load.
- Resource pressure: use supported test hooks to force allocation failure or fill a queue. Check the error path rather than exhausting resources unpredictably.
- Timing window: insert controlled delays around a suspected ownership handoff in a test build, and record exactly which delay exposes the issue.
- Disconnect and reconnect: interrupt a peripheral or test network at a defined state transition, with safe electrical limits.
- Counter boundaries: exercise supported simulated time or sequence rollover. Do not change a live system clock blindly and mistake resulting side effects for the original bug.
Start from a known-good configuration and keep a control run. If enabling logs makes the crash disappear, vary logging cost and transport while preserving the same event content. That observation supports a timing-sensitive hypothesis; it does not identify which race caused it.
6. Read evidence as a sequence, not a verdict
A fault at a memory copy may result from corruption much earlier. Compare the last valid ownership transition, buffer address and length, allocation lifetime and interrupt context. Look for a completion event after a timeout has already returned the buffer to a pool. For a deadlock, identify who owns each resource and whether the owner can still run.
If a backtrace is implausible, first verify the ELF match, stack integrity and unwind limitations. If no record survives, test the capture path independently with a deliberate fault. Retained RAM normally survives only particular reset paths, not arbitrary power removal; measure the actual reset and startup behavior.
7. Close the defect with a regression artifact
A useful fix explains the violated invariant, provides a minimal trigger and demonstrates the corrected behavior. Repeat the reproducer on the failing and fixed versions, then run the agreed wider workload. State run duration, number of cycles and untested conditions rather than claiming that an intermittent failure is impossible.
The handover should include capture settings, decoding instructions, matching symbols, representative logs and a regression test. Obeita’s ESP32-S3 Edge DTU project configuration illustrates a scope with serial, network and discrete-I/O activity that would need such an agreed workload; it is not a published crash investigation. For help defining the evidence package, see Firmware and BSP Diagnostics.